
Have you ever opened a spreadsheet to extract some meaningful information from it, only to become overwhelmed by the sheer volume of data points? You are not alone! A lengthy datasheet is a common output from farm management software or other data collection systems that you may use. To give a few examples:
- Farm management plans detailing what (fertiliser, chemical products, seeds), where (which paddock or farm) and when (summer knockdown, pre-emergent knockdown, desiccation) from farm management software.
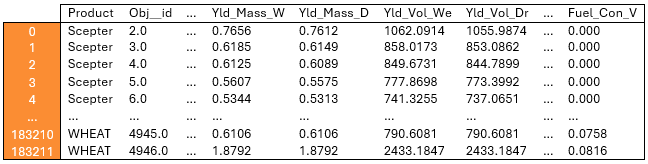
- Yield data straight from your header.
- Other agronomic data, such as historical soil testing data, often cover many years and multiple properties.
Table 1. An example of crop yield data obtained from a header
The information in these datasheets is a goldmine to help you fine-tune your farm operations, whether it is the timing of fertiliser or chemical applications, or even using yield maps and soil tests to start variable rate treatments. The challenge? There is often too much data to manually process and make sense of.
How does Planfarm TerraWise take the hard work out of farm data?
We use technology, specifically a programming language called Python, or, according to my colleague, the ‘matrix’, to crunch the numbers for us.
The best part? Python is open source, meaning it is free to use and continuously improved by a community of developers. It is highly customisable, making it the perfect tool to accommodate different tasks, including handling large datasets.
Saving time through automation
Much of the work we do at Planfarm TerraWise is very data heavy. Accurately processing lots of data is vital for our day-to-day activities. Instead of spending hours sifting through spreadsheets and running analyses, we use Python to automate key steps like retrieving data, processing information, and generating graphs and figures.
Removing these repetitive steps hugely improves our team’s efficiency, allowing us to focus on what really matters—helping farmers make better decisions.
Keeping it consistent
Consistency is key when it comes to carbon reporting. So, setting up the report in code means it is reproducible, no matter who generates it. The only difference? The farm-specific insights are tailored to your business.
Taking it a step further: APIs
APIs (Application Programming Interfaces) are incredibly useful tools that allow different software systems to talk to each other and exchange information. Think of it as a digital middleman that automates data retrieval, so you don’t have to do it manually.
In modern farming, where valuable data to drive a farming business comes from many different sources—think header data, soil test results, weather, production, and financial information— APIs can help gather large amounts of data with the click of a button.
Example 1: Climate data in your report
When it comes to climate data tailored to your farm property, we tap into the SILO LongPaddock API, which lets us access to Bureau of Meteorology (BOM) weather stations from all over Australia.
Here is how the API works; imagine you are at a restaurant, we are the customer, the waiter is the API, and the kitchen is the weather station.
- You place an order (request weather data).
- The waiter (API) takes the order through to the kitchen (the weather station).
- The kitchen prepares and cooks your food (processes your request and sends through the appropriate data).
- The waiter delivers your food, which is your requested data.
Instead of manually clicking through one weather station at a time, we can pull data from as many stations as we wish simultaneously, setting rules around the quality and quantity of the weather station data, ensuring greater accuracy. We then use code to process the weather data to extract and summarise the weather variables we want to report on. This all occurs in a matter of seconds.
This weather data is then used in our farm assessments and reporting for carbon projects and accounting.
Example 2: Carbon accounting report
You may have heard about the University of Melbourne’s emission calculators, and these spreadsheets can help calculate emissions on-farm. We have automated the entire process of calculating these emissions, from data ingestion to reporting. How? We have partnered with AIA (Agricultural Innovation Australia), who translated these calculators into code and developed an API.
Here is a quick summary of how it works:
- We gather the required information to calculate farm emissions through a questionnaire (for a new client) and/or your existing Planfarm file (for existing Planfarm clients).
- Our team reviews the data, manipulates and sends it off to AIA’s API.
- The emissions output from the API is then seamlessly integrated into reports for carbon accounting, with visualisations that make the information easier to interpret.
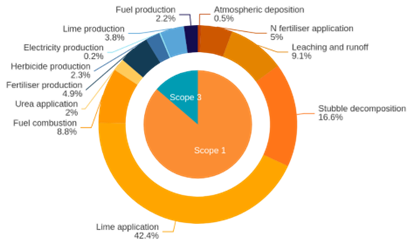
Figure 1. An example of how your data can be transformed into a figure in your carbon accounting report
The future of farm data analysis
The examples above are just snippets of how coding is changing the way we work. By combining automation with intelligent data processing, what used to take a full day—gathering inputs and generating figures—can now be done at the click of a button. That means our advisors can spend more time focusing on what really matters: helping you get the best results for your farm.
As we progress in the digital era, huge datasets are inevitable, and analysis with just spreadsheets will continue to become harder and less practical. Programming languages, like Python, help improve workflow efficiency and scalability, automate repetitive tasks, and ensure consistency—so we can turn all that raw data into meaningful, actionable insights.