Two droughts in a row have a big effect, but most businesses can handle it.
Three droughts have a big effect on most businesses.
But some businesses can handle five.
That is the answer from a recent project I undertook with funding from the Midwest Development Commission.
In short, our farm businesses have grown significantly in balance sheet strength in recent years, and while droughts have a big effect, many businesses are very resilient.
This project aims to model five years of successive drought. This scenario is unlikely to play out in reality, but it was designed to test the true resilience of the farming business in the Midwest.
The area in question is the shires of City of Greater Geraldton (Geraldton, Greenough, Mullewa), Northampton and Chapman Valley utilizing the data of 35 Planfarm clients.
Businesses in the Midwest
We assessed farm financial performance on a balance sheet (assets and liabilities or equity) and profit basis using a number of metrics to give businesses a score out of 10 for balance sheet strength (Equity) and profit. The table below illustrates how the businesses were ranked for Profit and Balance sheet strength (Equity).
Table 1: Assigned weightings and ranks for quantitative parameters.
| Data Point | Value for a rank of 1 | Value for a rank of 5 | Value for a rank of 10 | Ranking Value % | ||
| Equity | Loan-to-Value Ratio | >65% | 45% | <25% | 25% | |
| Outright Equity | <$4m | $7m | >$12m | 25% | ||
| Equity Percentage | <55% | 70% | >95% | 25% | ||
| Debt to Income Ratio | >2:1 | 1:1 | <0:1 | 25% | ||
| Profit | Net Profit Before Tax per hectare (NPBT) | <$0 | $120 | >$320 | 33% | |
| Operating Efficiency (OPEX) | >82% | 66% | <50% | 33% | ||
| Return on Capital percentage (ROC) | <2% | 6% | >12% | 33% | ||
Measuring Business Growth
The average equity of the businesses in the survey data was $9,443,058 in 2015 and has grown to $32,857,916 at the end of 2024 on the back of farm expansion, land value growth, and retained profitability.
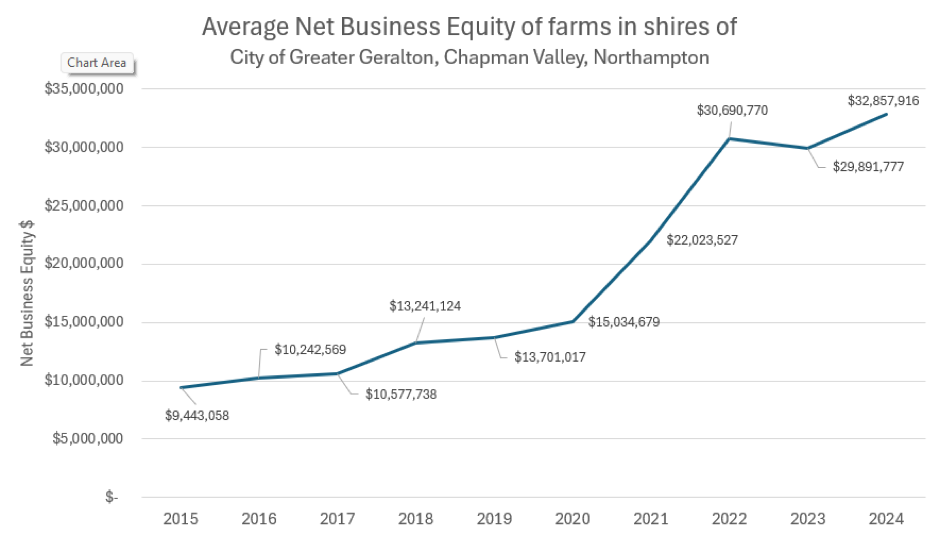
Figure 4: Time series of average annual net business equity ($) for businesses within the study area and with 10 years of accumulative data (2015-2024).
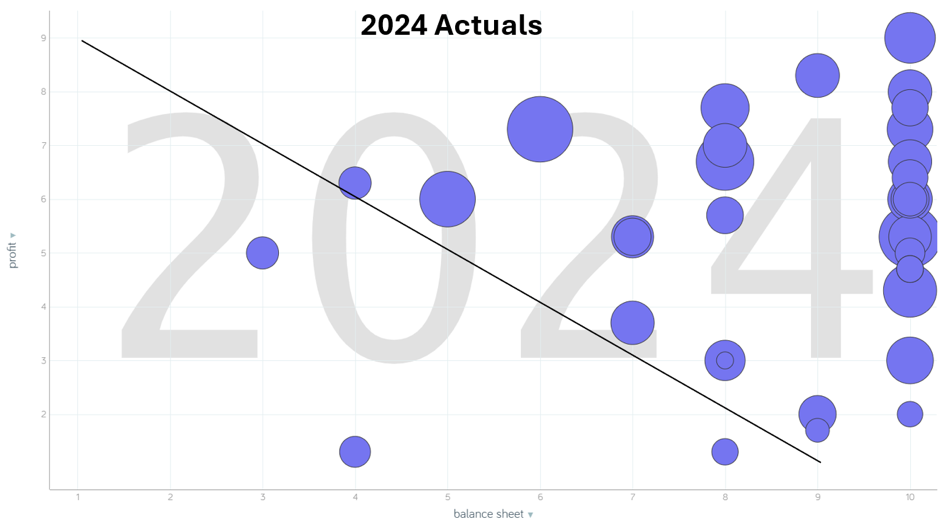
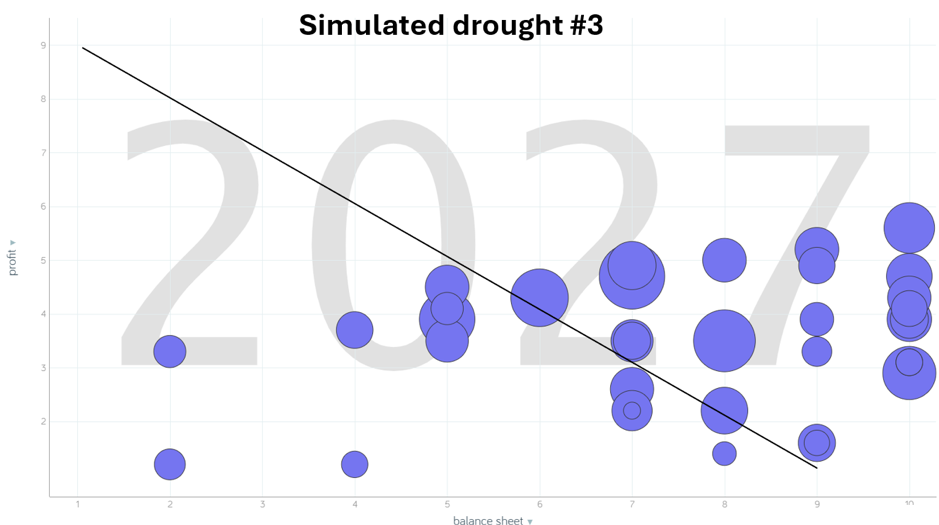
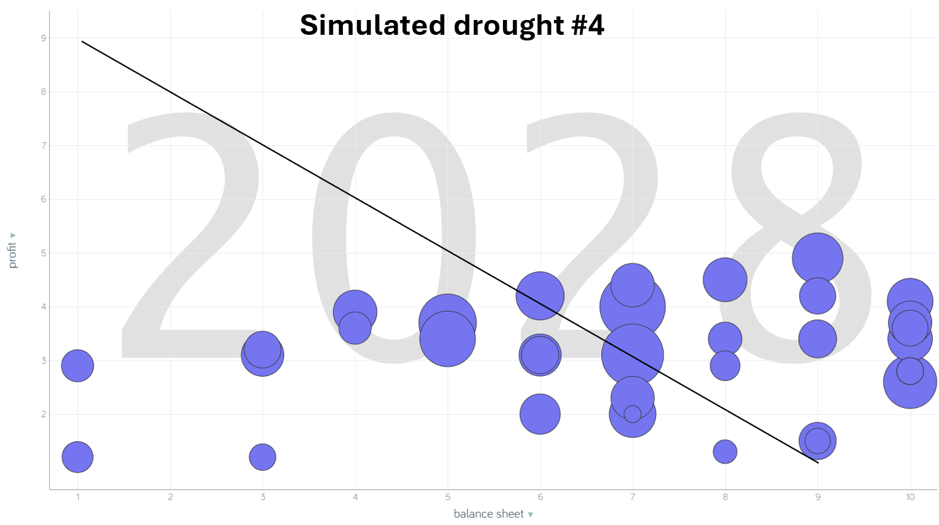
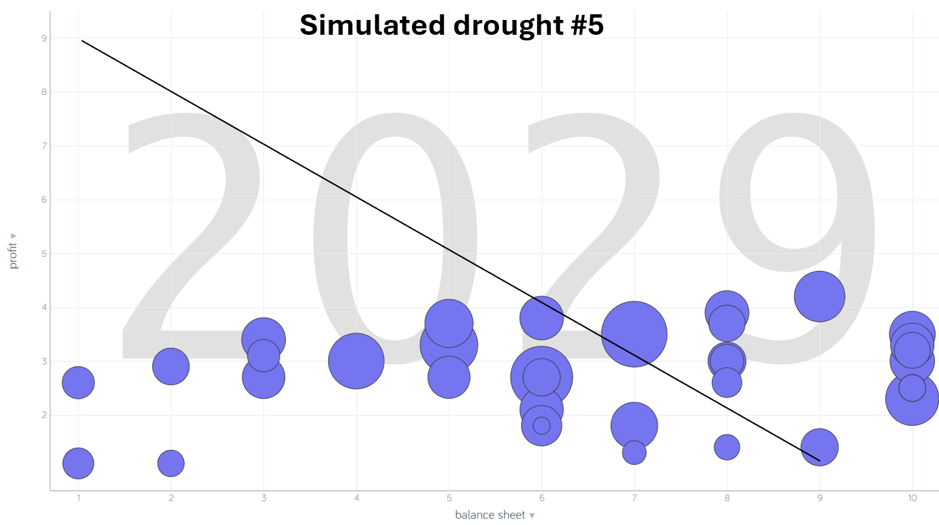
The bubble charts below are used to demonstrate the results of this study.
The size of the bubble corresponds to the size of the farm. Farm size ranged from 1000 hectares to over 15,000 hectares, with the average being 6500 hectares.
For each graph, the Y axis (vertical axis) is the ranked score out of 10 for the profit resilience metric. On the X axis (horizontal axis) is the balance sheet resilience metric score out of 10.
The resilience line
The diagonal line on the charts below is what is known as the resilience line. This resilience line is not a hard and fast rule, and should be considered as a guide. Generally speaking, farm businesses that fall above this line have a greater resilience to drought.
2024 bubble chart – year zero
2024 can be considered year zero in the sequence of droughts. The data in this chart are actuals for the 35 businesses in the study to the end of the 2024 calendar year.
We can see in the bubble chart below that only three businesses were below the resilience line at the end of 2024. Two of these businesses are start-ups with no generational wealth transferred to them.
Several farm businesses had recently purchased more land either in 2023 or 2024, which reduced their balance sheet strength due to the borrowing required to purchase the land.
2025 bubble chart – simulated drought #1
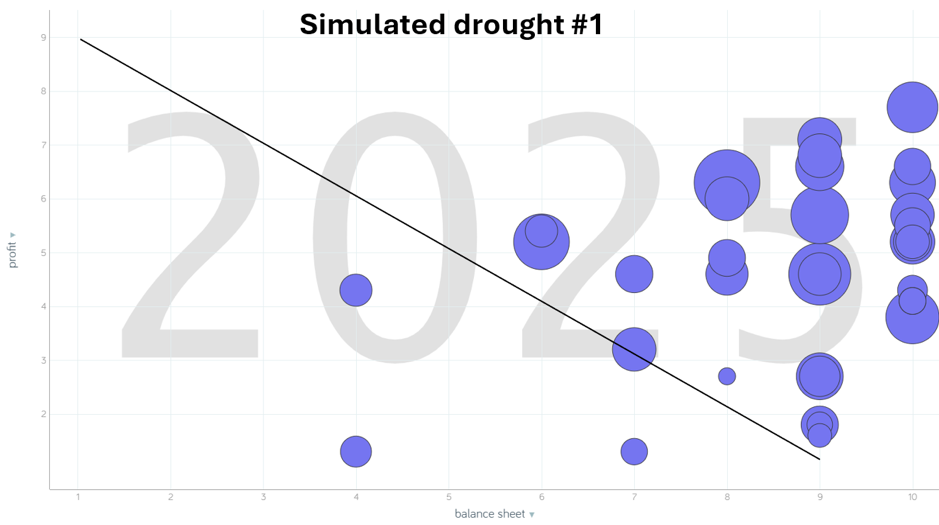
The chart below shows the simulated profit and balance sheet strength after a year of drought.
After one year of drought, there has been only a minor effect on balance sheet strength, with most businesses still residing above the resilience line.
2026 bubble chart – simulated drought #2
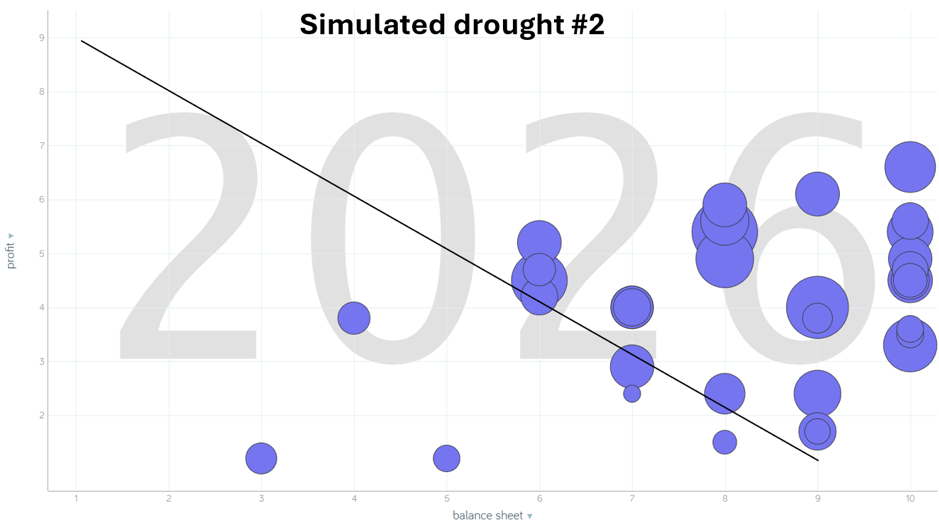
Once again, we see the businesses’ reduced profit resilience after two droughts, but most companies maintain their strong balance sheet strength after a second consecutive simulated drought.
Generally speaking, two years of drought have had a considerable impact on a moderate number of businesses, but most businesses remain resilient.
2027 bubble chart – simulated drought #3
It’s this third consecutive drought that is starting to show a big impact on these businesses. We now have twelve businesses below the resilience line. Remarkably, we still have eight businesses with a 10 out of 10 for balance sheet strength.
2028 bubble chart – simulated drought #4
As consecutive droughts continue, we see more businesses drop below the resilience line.
2029 bubble chart – simulated drought #5
If the unthinkable were to happen, and we experienced five consecutive droughts in a row to the scale of the worst recorded financial outcome to date, the chart below shows what our farm businesses may look like.
The effect of the rainfall zone?
In 2024, there appears to be no strong correlation between rainfall zone and farm business resilience, except there are more high rainfall businesses with a low profit resilience ranking (toward the bottom of the graph). However, after five consecutive simulated droughts, farms in the low rainfall zone have been hit the hardest for Equity resilience with the biggest shift to the left of the three groups.
Qualitative study
A qualitative study was undertaken whereby consultants ranked their clients for a range of qualitative measures. This part of the study was very eye-opening. To summarise, all of the businesses in the high profit, high equity quartile performed well in all of the qualitative measures of business culture, management ability, timing of operations, machinery efficiency, operational style, and attitude to risk.
Most of the businesses that are ranked below five out of ten for profit received a low rating for one or more of the qualitative measures.
This qualitative study goes a long way to understanding why some businesses are thriving while others are not.
Major findings of the study
- Many businesses can handle three years of drought, but 5 is a big effect. It seems that most can handle 2 years, but after 3 years, there is a noticeable shift to many more businesses under the resilience line.
- There was no correlation between rainfall zone and business resilience at the start of the project period (2024), but the strong balance sheets of the high and medium rainfall farms due to the high land values certainly increased the resilience of these businesses.
- Businesses that have benefited from generational wealth plus have successfully implemented good management are best placed to withstand shocks such as droughts.
- Growers who lease a lot lose balance sheet strength quickly in the event of a drought.
- The cohort is dominated by businesses that still have a very strong balance sheet after even 5 years of drought which is amazing. This shows the importance of having a strong balance sheet that we sometimes refer to as the backline of the business.
- It’s not just the biggest farms that can withstand droughts. Some big farms lost balance sheet strength, and some medium farms maintained good balance sheet strength. This is a very key finding. The push for scale has had its negative side in some instances, particularly where expansion happens just before a run of dry seasons.
- It’s very hard for a start up business, who probably lease a lot, to withstand more than two or three successive droughts.
- If you buy land just before a drought, the timing is unfortunate as your balance sheet has just dropped before the droughts. The same goes for splitting the farm just before drought and succession payments.
- Most of the businesses that are ranked below five out of ten for profit received a low rating for several of the qualitative measures. The challenge is to communicate these shortcomings to the growers in a way that brings about positive change.
Conclusion
The farm businesses in the Midwest presented in this review are mostly moderate to strong when it comes to resilience to drought and other shocks. The recent growth in balance sheet strength due to increases in farmland value and profits generated in a run of good seasons from 2016 to 2022 has built the balance sheet of most businesses to such a high level that most can withstand successive droughts. However, we should point out that this study did not alter the future farmland value. If the region were to experience a series of consecutive droughts, it is highly likely that farmland value would decline, which would have a significant effect on balance sheet strength.

