Repairs are out of control.” It’s a comment I’ve heard — and made — more than once this summer. Yet one point remains: this is not true for everyone!
In 2021, I analysed Planfarm client spending on repairs and maintenance (R&M). The conclusion was clear: there was no consistent pattern linked to plant age or investment level. R&M costs reflected management capability, not the age, colour, or scale of machinery. The belief that newer gear reduces R&M did not hold up.
Revisiting the data in 2025 (Table 2) and comparing it to 2021 (Table 1), several changes stand out.
Firstly, plant investment relative to gross income has increased. Machinery inflation is a major driver, with large items now commonly exceeding $1 million. In addition, COVID-era instant asset write-offs combined with strong profit years accelerated capital purchases. Many businesses took advantage of the opportunity, resulting in Plant lists that have more than doubled in this short period, and the annual depreciation cost has also ballooned!
Secondly, R&M costs per hectare have materially increased. In 2020, most businesses ranged between $10–$40/ha. Today, that range is closer to $30–$80/ha. R&M is more expensive than it used to be. What is even more confronting is the absolute cost for farms that have experienced a per-hectare increase, as well as increased their scale.
However, the most important observation remains unchanged: there is still a wide range between businesses in R&M costs per hectare. This can be observed when we look vertically in each graph. Observe businesses at a similar plant investment level that have markedly different R&M/ha costs? I.E. at 80% Plant Investment Ratio, why can one business get away with $40/ha while many others are paying close to $80/ha in R&M costs? The variation observed in 2021 persists; some businesses are clearly more disciplined or effective in managing this cost. Inflation explains the rise in costs as outlined above, but not the difference between operators.
One thing remains certain: buying new machinery does not permanently reduce R&M. There may be a short-term dip during the initial warranty period, but warranties are limited and offer little operational flexibility. The underlying management challenge regarding the cost to maintain the plant list remains.
Tables 1 & 2 present similar data, Table 1 for 2021 and Table 2 for 2025. Both tables use a ratio of the Plant List gross value to Gross Farm Income to determine a relative “value” or “age” of the plant list. The benchmark target is to have a plant list that has a value at 80%-100% of the average gross income. Above this, and you could be overcapitalised; below this, and your plant list could be restricting your profitability. The sweet spot is 60%-80%. This is dependent on many factors, and I encourage you to discuss your situation with your consultant. Other metrics to consider the appropriateness of your plant investment include the Plant list value/Ha. This metric can be distorted when comparing businesses from different rainfall zones.
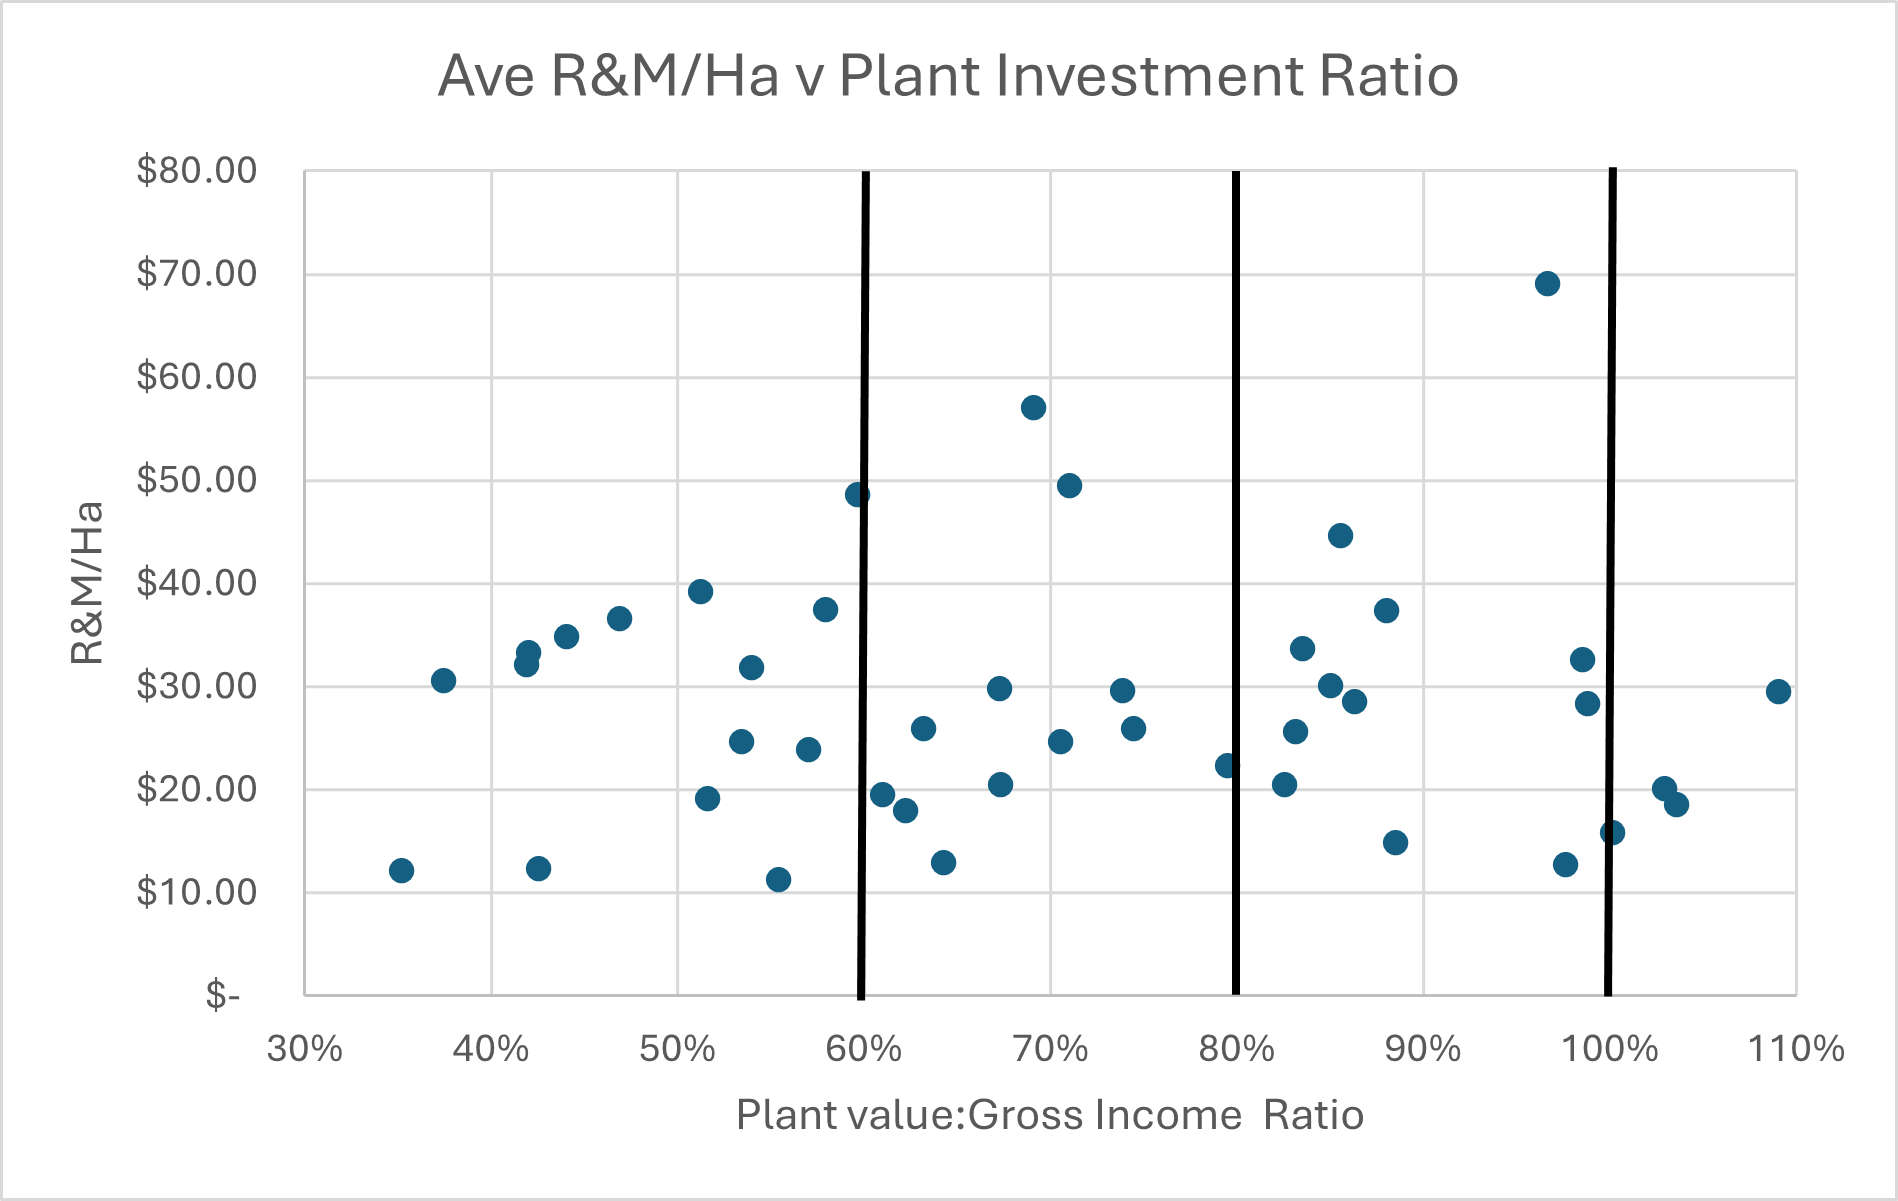
Table 1: The relationship between Plant investment and Repairs/ha from a client data set in 2021
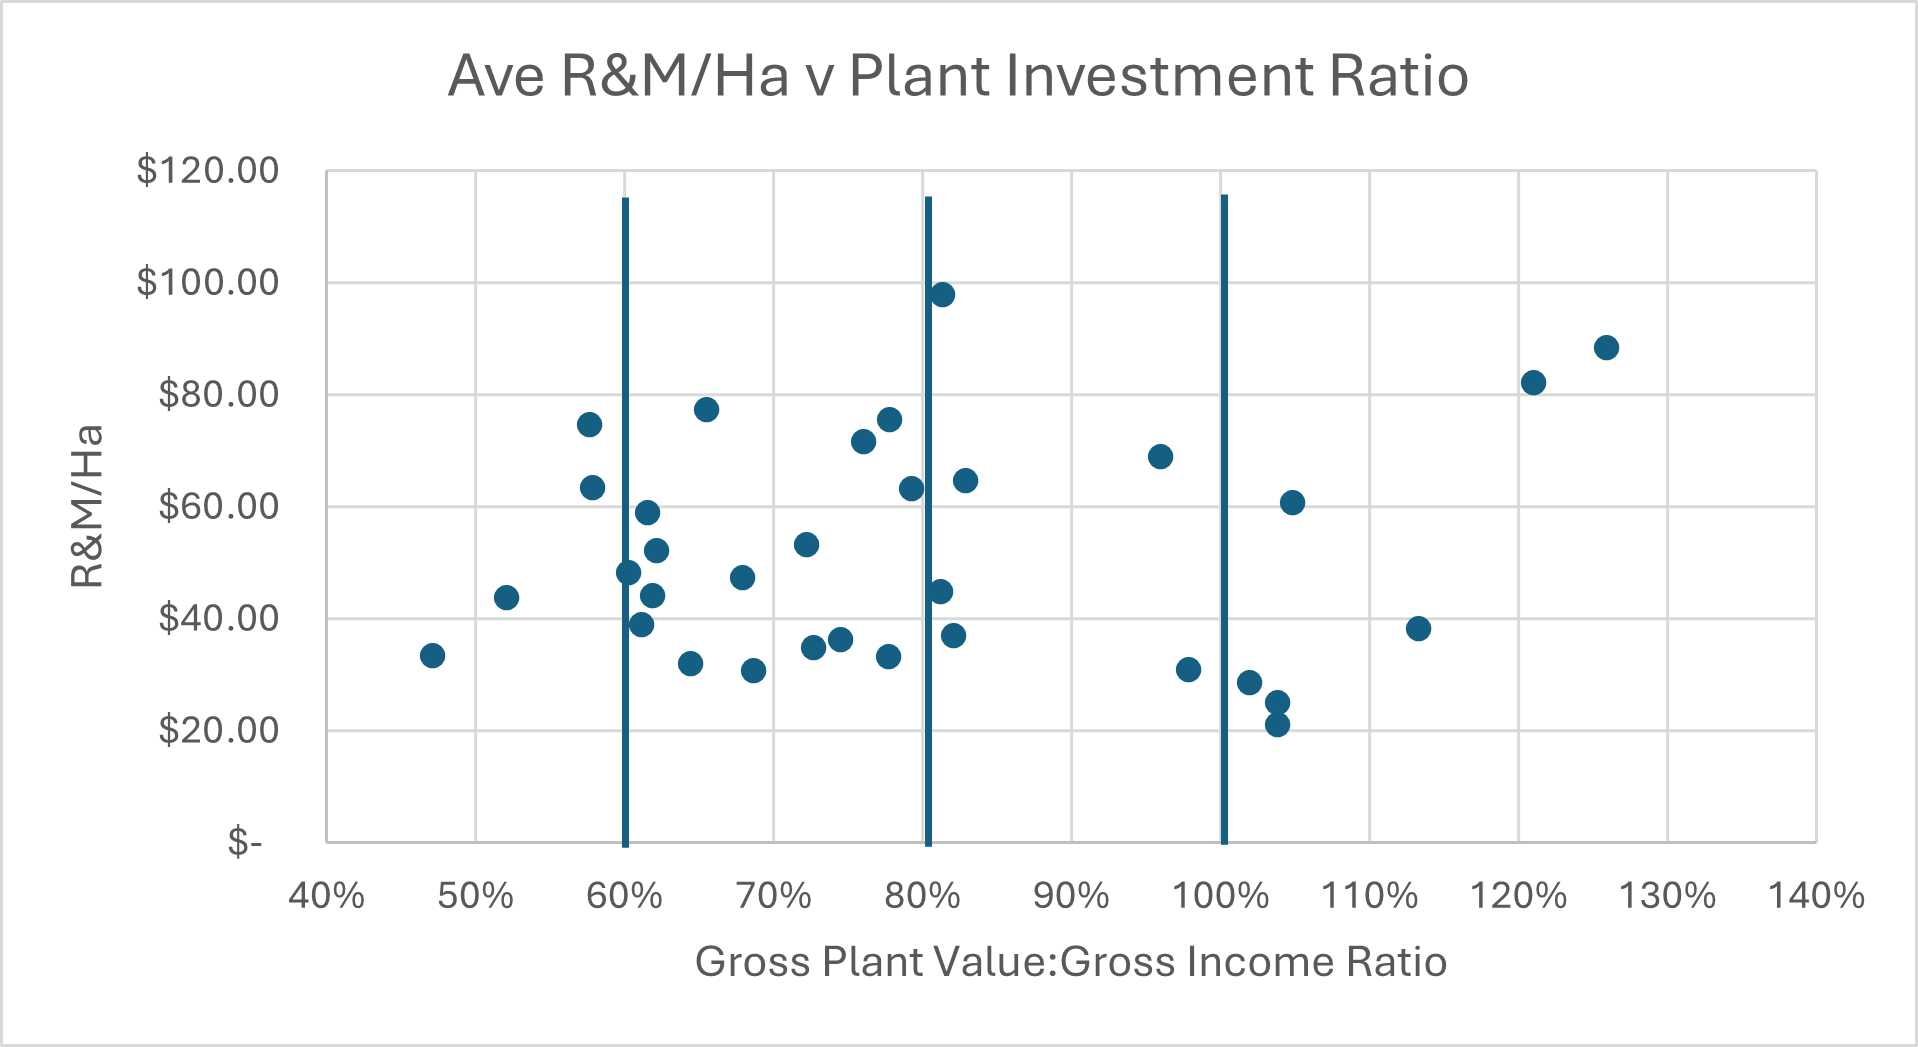
Table 2: The relationship between Plant investment and Repairs/ha from a client data set in 2026.
Practical observations from listening to clients:
- In-house mechanics can work well, but only with firm oversight. Without discipline, the mindset can drift toward “fix everything perfectly,” which quickly turns into unnecessary cost.
- External mechanics can be efficient, but only if jobs are grouped, and callouts minimised. Poor planning guarantees higher bills.
- Communicate what’s essential vs. optional. Not every repair requires the premium solution.
- Invest in operator training and the right tools. Reducing reliance on external services, even modestly, can move the needle.
- Know your critical control points. Seeding, spraying, harvest — where does breakdown risk hurt you most? Where is your R&M spend concentrated? Your cashbook should provide this visibility.
- Daily care matters. Basic habits such as checking over machines at the start of every day of operations, as well as operating machinery carefully, can be effective.
- A useful benchmark: R&M vs fuel: Historically, R&M tracked reasonably closely to fuel and oil — both proxies for how hard the plant is working. In the last two years, however, I have seen several businesses where R&M has overtaken fuel. If repairs are rising faster than fuel, it’s a red flag.
Pulling it together
R&M is a major cost centre and one that has risen sharply. But the gap between businesses shows that the driver isn’t just inflation — it’s management. Decisions around maintenance planning, operator culture, oversight, and investment discipline determine where a business sits within the current R&M range.